Terminology
Alpha (α)
The alpha coefficient measures the portion of an investment’s return arising from specific (non-market) risk. It can be a positive or a negative number. Often referred to as a manager’s “value added” (or “value subtracted”), alpha measures the difference between actual returns and expected performance resulting from exposure to specific risk factors.
Beta (β)
The beta coefficient measures an investment’s relative volatility or impact of a per-unit change in the independent variable (market) on the dependent variable (portfolio), holding all else constant. The beta of a portfolio is its covariance in relation to the market. The market portfolio has a beta coefficient of 1. A higher (lower) beta would imply more (less) volatility.
Book-to-Market (BtM) Ratio
![]() The “BtM” is the ratio of a firm’s book value of equity to its market value of equity. Book value of equity is determined by the firm’s accountants using historic cost information. Market value of equity is determined by buyers and sellers of the stock using current information. A high (low) BtM ratio indicates that the book value per share is high (low) relative to the stock price.
The “BtM” is the ratio of a firm’s book value of equity to its market value of equity. Book value of equity is determined by the firm’s accountants using historic cost information. Market value of equity is determined by buyers and sellers of the stock using current information. A high (low) BtM ratio indicates that the book value per share is high (low) relative to the stock price.
Coefficient of Determination (R2)
 The coefficient of determination, which ranges between 0 and 1, indicates the goodness of fit of a regression model. It shows the proportion of the total variance of the dependent variable explained by the regression model. An R2 of 1 indicates that the model explains all of the variation of the dependent variable. An R2 of 0 indicates that the model explains none of the dependent variable’s variance. In many applications, a higher R2 is preferred to a lower one.
Convexity
Convexity is the ratio of change in duration for a given change in yield—the change in the slope of the price as a function of a change in yield (second derivative of the price function). In general, convexity increases with longer maturities and smaller coupons and yields.
Correlation Coefficient (ρ)
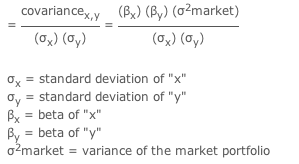 The correlation coefficient measures the degree to which the movements of two variables are related. It indicates how close the residuals are to the regression line and is calculated as the square root of the coefficient of determination.
Cost of Capital
A company issues stock (or debt) in exchange for capital to fund its operations. The investor provides this capital by purchasing shares (or bonds) in exchange for an expected return. Because the company foregoes the return on the stock or debt it issues, its cost of capital is identical to the investor’s expected return.
Covariance
Covariance measures the degree to which two variables move together over time relative to their individual mean returns. It is calculated by multiplying the correlation between two variables by the standard deviation for each of the variables.
= ρ (σx) (σy)
Current Yield
 Current yield is calculated as the annual interest on a fixed income security divided by its market price.
Decile
A decile is a portion within a whole that has been divided into ten equal parts. For example, the population of issues on the NYSE can be broken into ten deciles according to market capitalization, each containing the same number of stocks.
Degrees of Freedom
The degrees of freedom is the number of values in the calculation of a statistic that are free to vary—the total number of observations in the sample minus the number of samples.
Dependent Variable
The dependent variable is a response variable (i.e., expected return) whose behavior is to be measured as a result of the manipulation of independent variables in an experiment. Ideally, the dependent variable should be reliable, sensitive, and easy to measure.
Dividend Yield
 Dividend yield is the contribution to annual total return that an investor earns by receiving dividends. It is determined by dividing the dividend per share by the current stock price.
Duration
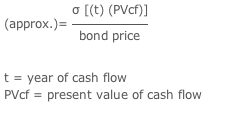 Duration measures bond price volatility by calculating the weighted average term-to-maturity of a bond’s cash flows, where the weights are the present value of each cash flow as a percentage of the bond’s full price. Duration rises with maturity, falls with the frequency of coupon payments, and falls as current yields rise (higher yields reduce the present value of the cash flows).
Earnings-to-Book (EtB) Ratio
 “EtB” is the ratio of a firm’s current (or predicted) earnings per share to the book value per share of its common stock. Because book equity is relatively stable, division of earnings by book equity emphasizes changes in earnings through time. A low (high) EtB ratio indicates a firm with low (high) earnings relative to book value.
Efficient Market Theory
“EMT” is the theory postulating that market prices reflect the knowledge and expectations of all investors. It asserts that any new development is instantaneously priced into a security, thus making it impossible to beat the market consistently.
Expected Return
 “E(R)” is the mean value of the probability distribution of possible returns.
Factor Loading
Factor loading is an asset’s sensitivity to an economically important return.
Independent Variable
An independent variable is a factor whose effects are to be studied and manipulated in an experiment (i.e., exposure to market, size, and/or value risk).
Market Capitalization
Market capitalization is the value of a company as determined by the market price of its issues and outstanding common stock. It is calculated as the product of market price and shares outstanding.
= (stock price) x (shares outstanding)
Mean (average)
 This measure of central tendency indicates the point at which a population of observations is measured. Equals the sum of the observations’ values, divided by the number of observations.
Median
This measure of central tendency is used to indicate the point at which a population of observations is measured. It is the point in the distribution at which 50% of the observations will have values greater than or equal to the median, and 50% less than or equal to the median.
Mode
Mode is the measure of central tendency that indicates the point(s) at which a population of observations is measured. It is the value in a distribution that occurs most frequently.
Nominal Yield
 Nominal yield is calculated as the annual dollar amount of income received from a fixed income security divided by the issue’s par value (usually $1000). This yield is also called the coupon rate.
Population
A population is the entire collection of observations that is the focus of analysis.
Price-to-Earnings (PtE) Ratio
 “PtE” is the ratio of the market price of a firm’s common stock to its current (or predicted) earnings per share. A high (low) PtE ratio is often an indicator of market sentiment in the continued growth (decline) of a firm’s earnings.
Regression
A statistical technique used to establish the relationship of a dependent variable (e.g., excess return) and one or more independent variables (e.g., exposure to market, size, and value risks).
Slope coefficients measure the sensitivity of the dependent variable to changes in the independent variables. By measuring exactly how large and significant each independent variable has historically been in its relation to the dependent variable, the future value of the dependent variable can be estimated. Essentially, regression analysis attempts to measure the degree of correlation between the dependent and independent variables, thereby establishing the latter’s predictive values.
Risk Premium
The risk premium is the additional return an investor requires to compensate for the risk borne.
Risk-Free Rate
The risk-free rate is the current interest rate on a default-free bond in the absence of inflation.
Sharpe Ratio
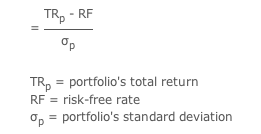 The Sharpe ratio is the relative measure of a portfolio’s return-to-risk ratio. It is calculated as the return above the risk-free rate divided by its standard deviation.
Standard Deviation (σ)
Standard deviation is the statistical measure of the degree to which an individual value in a probability distribution tends to vary from the mean of the distribution.
It is widely applied in modern portfolio theory, where the past performance of securities is used to determine the range of possible future performance, and a probability is attached to each performance. Generally speaking, the greater the degree of dispersion, the greater the risk. = (σ2)1/2
Standard Error
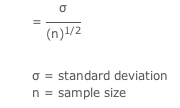 The standard error measures the standard deviation of the dispersion about the regression line (least squares regression line has the smallest sum of squared errors). It is also referred to as “unsystematic variation”—the variation not explained by the regression line.
T-Statistic
 The “t-stat” tests whether or not a given correlation coefficient is statistically different from zero. Generally, a correlation coefficient with a t-stat of ≥1.96 or ≤-1.96 (95% confidence level) indicates that the coefficient is significantly different from zero. Said differently, at ±1.96, there is a 5% chance that the coefficient is not different from zero.
Variance (σ2)
 Variance measures the dispersion of a return distribution. It is the sum of the squares of a return’s deviation from the mean, divided by n. The value will always be ≥ 0, with larger values corresponding to data that is more spread out.
Yield to Maturity
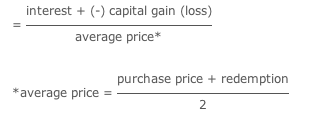 The “YtM” is the rate of return if a long-term, interest-bearing security is held to its maturity date.

